

Data Visualization Guidelines
One of my first projects after joining the newly formed Design System team was to rethink our data visualization and provide a framework along with a guideline for how teams can leverage charts within Mailchimp.
Our first draft of the guidelines are live here.
Defining a Color Palette
One of the first issues I decided to tackle since it was the most glaring.
There were a few things I saw as problems based on user interaction and hearing from teams that had built charts in the product.
There are so many colors to choose from that it’s difficult to know if you’re choosing the right colors
We most often used ONLY value to differentiate between categories rather than hue, saturation, AND value.
Not choosing the right colors is also prime for being an accessibility problem: people with color-vision deficiencies, low-vision, or displays with low-range might not see graphs to their full efficacy.

Based on the colors we already had in our brand, I used a few different tools to create a palette that varied by hue, value, and saturation in a predictable, mathematical curve so we could justifiably scale up the number of colors in the future. Each main hue was used to create eight main palette items.

So now we had a nice, streamlined palette. But one of the other problems still existed: How do we combine these colors effectively so that the appear with enough contrast for all people? This same palette looks completely different fo someone with a color-vision deficiency:

So one way that we could safeguard from colors that appeared too similar from being placed next to each other would be to develop a sort of pre-defined combination of colors that was accessible while using this palette.
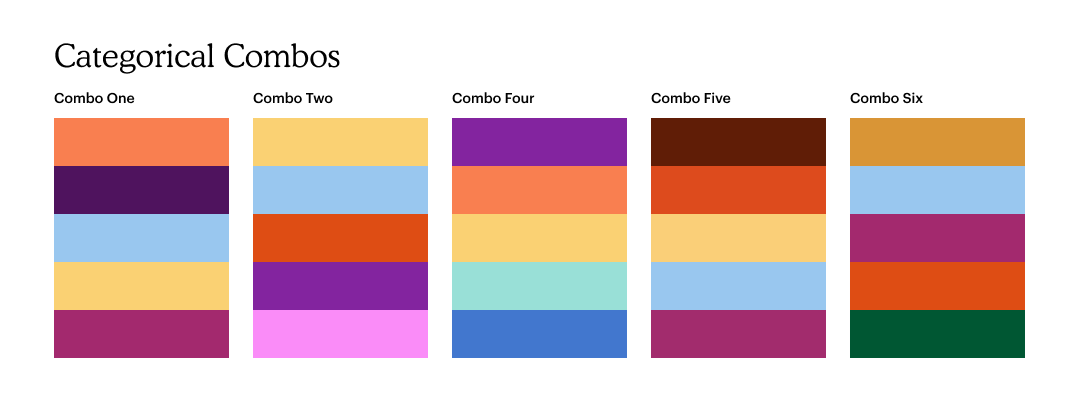
These combos could now be used for any chart that had multiple categories represented and sill appear distinct to a very wide range of abilities.
Instead of choosing individual colors for each category in each chart, designers and engineers could simply choose a combo and our tools would simply move through the sequence of colors and apply them to the chart.
Below is the same combos but as someone with a version of color-blindness might see them:


